
Change to Dashboard Pages
The Summary
For a number of years, we have published "Dashboard" pages for a variety of datasets. These are a type of view called a "Data Lens" that can not only display graphs of the data from the dataset but allow for filtering one graph and having that filter apply to all other graphs (formally called "cards") on the page.
Knowing that users may depend on Data Lens pages in various ways, we want to make an announcement. The company that hosts our data portal is in the process of deprecating those Data Lens pages.
Its recommended replacement is "Story" views. This is a new type of view that we may use for other purposes. To ease the transition, the company has converted each of our Data Lens pages to a Story page.
Naturally, the two types of view differ in some ways that make the conversion tricky, all the more because the conversion in bulk (as opposed to individually) follows a cookie cutter pattern in mapping a Data Lens element to a Story element. While mostly functional, the converted dashboards will not necessarily have the features and visual appeal we eventually hope to be able to build into new dashboard pages.
The Story tool is a work in progress. Even native Story pages, have some issues, which we hope will improve over time. Therefore, for the most part, the converted dashboard pages will be live but hidden, in the sense that the links will work but be not returned by searches within the portal.
The company has a number of articles on Story pages and we encourage those seeking an in-depth understanding to use that resource. However, in this page we wish to give a basic explanation of what to expect.
Please feel free to e-mail us with any questions, comments, or concerns. We are always very interested in feedback, and especially after a change like this one.
 Old and New
We are using the Dashboard page for the Building Permits dataset to demonstrate the changes.
The most important thing to know is that the URL will not change. The Dashboard link in the previous paragraph goes to the Data Lens at the time of this writing but will go to the Story after the conversion.
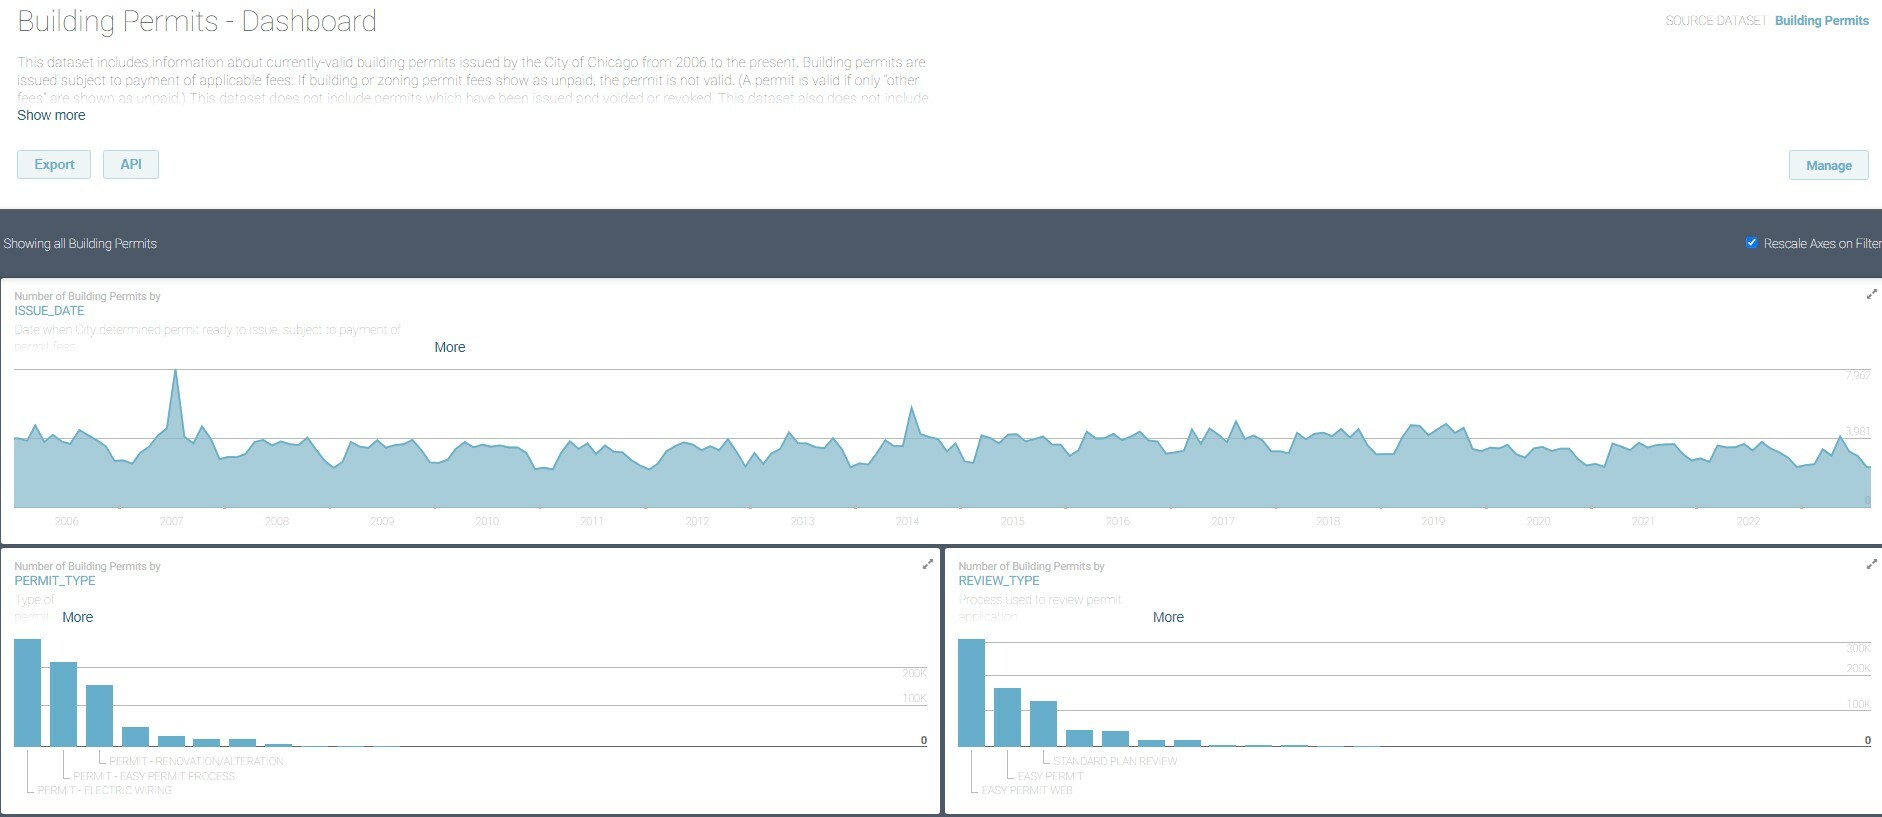
Building Permits Dashboard - Old
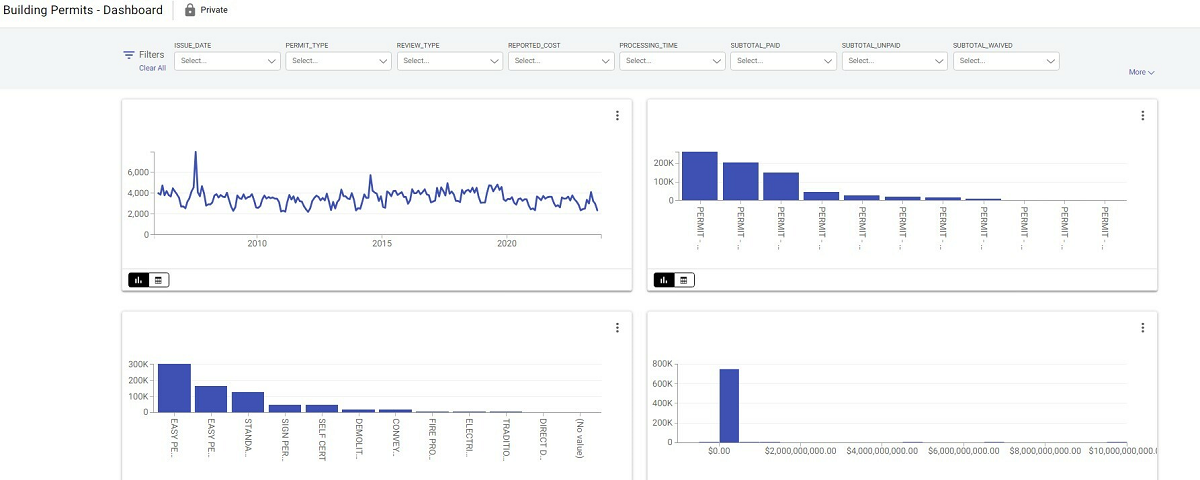
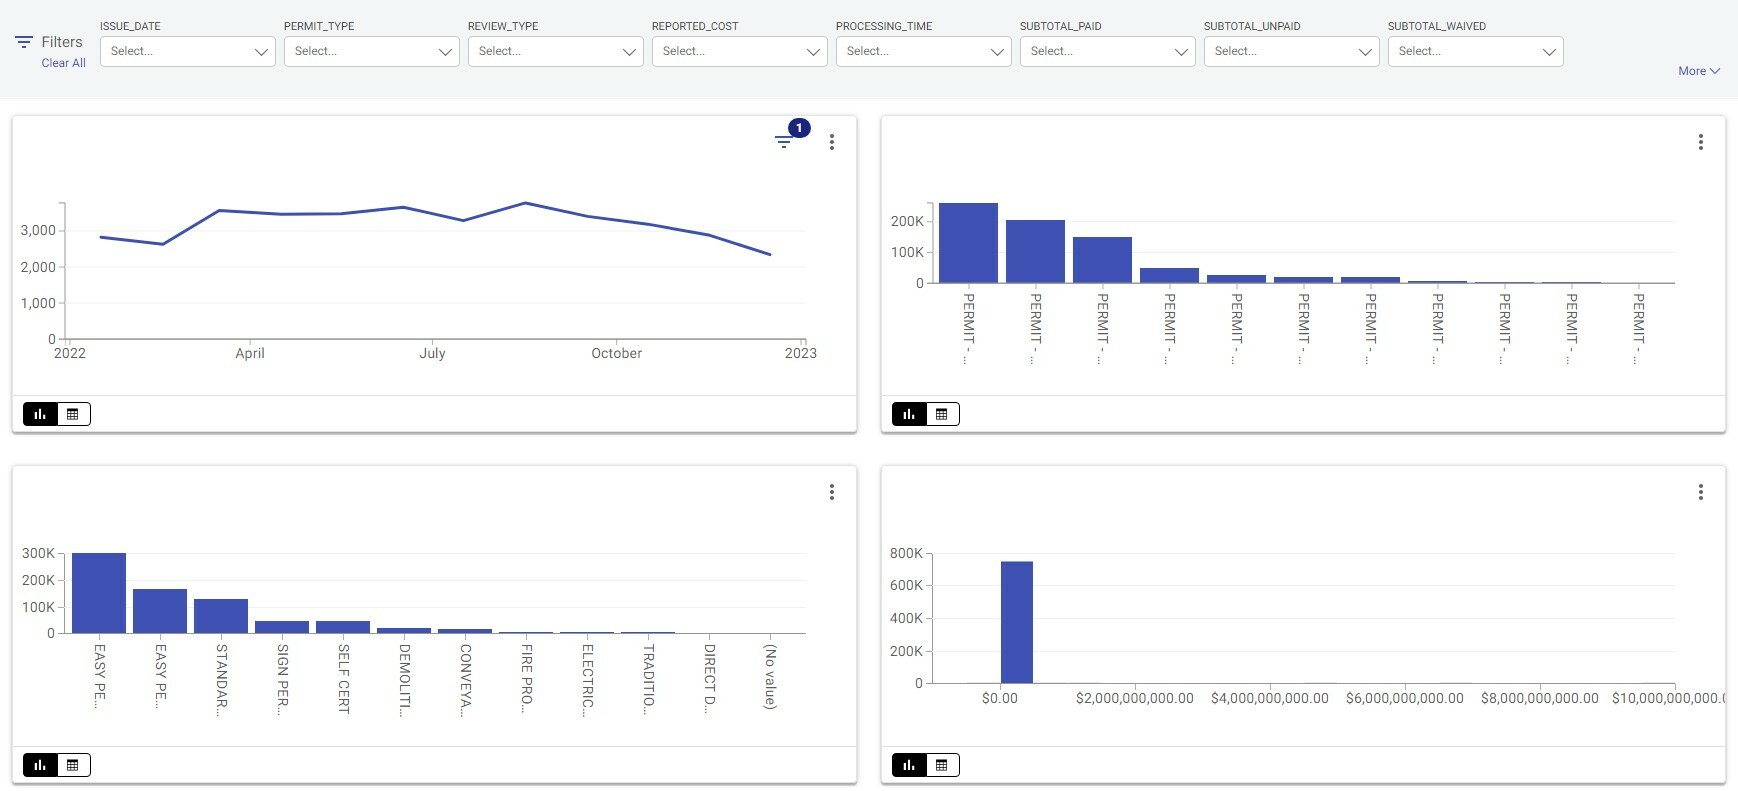
Building Permits Dashboard - New
Filtering
One of the most powerful features of both Data Lens pages and Story pages is the ability to filter all charts in the same manner. For example, suppose we want to see only data for 2022.
Global Filtering
In a Data Lens, one can filter all charts by selecting the desired values on one of them, such as the region of the timeline chart showing 2022.
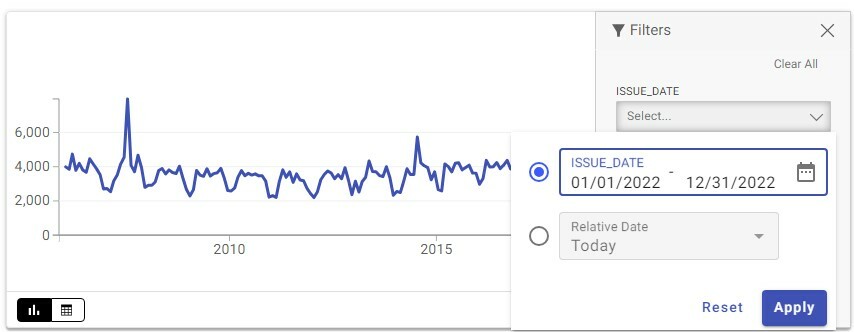
In a Story, the corresponding action is to use the "Global Filter" at the top of the page to select the desired vales from the relevant filter.
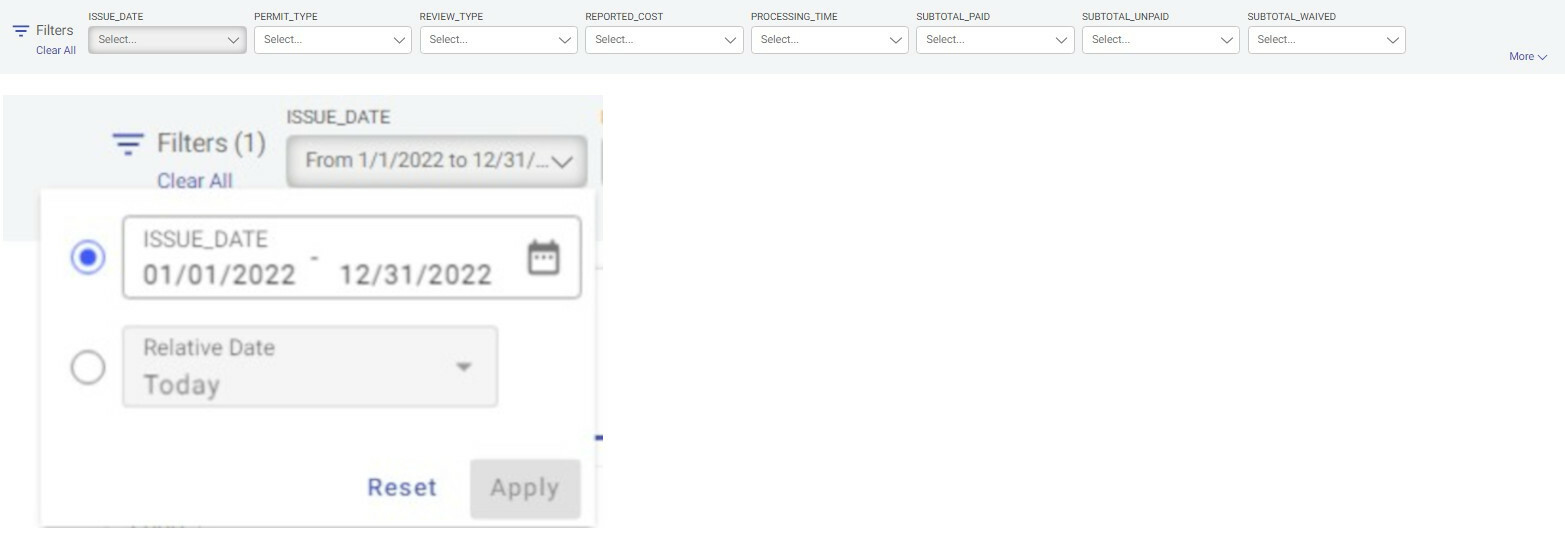
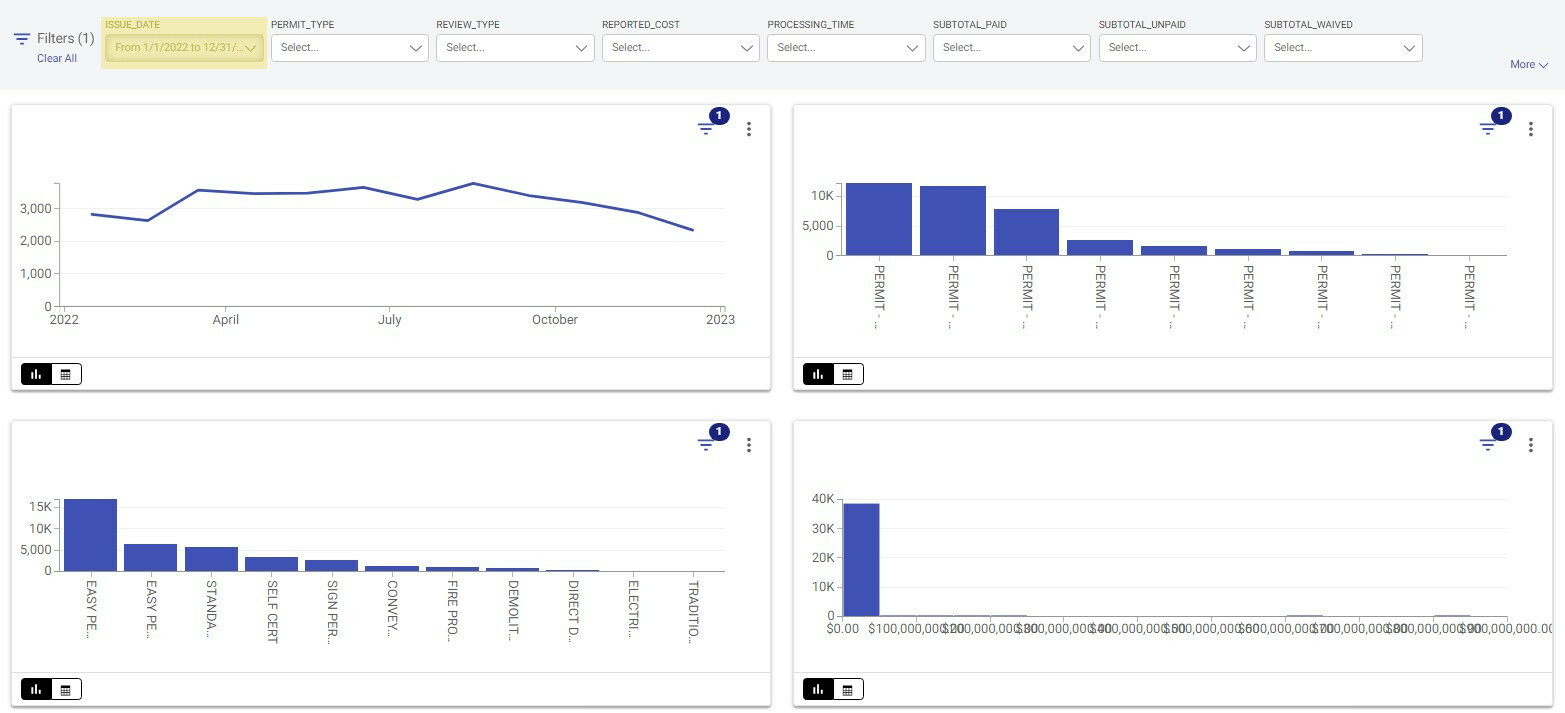
Chart-Specific Filters
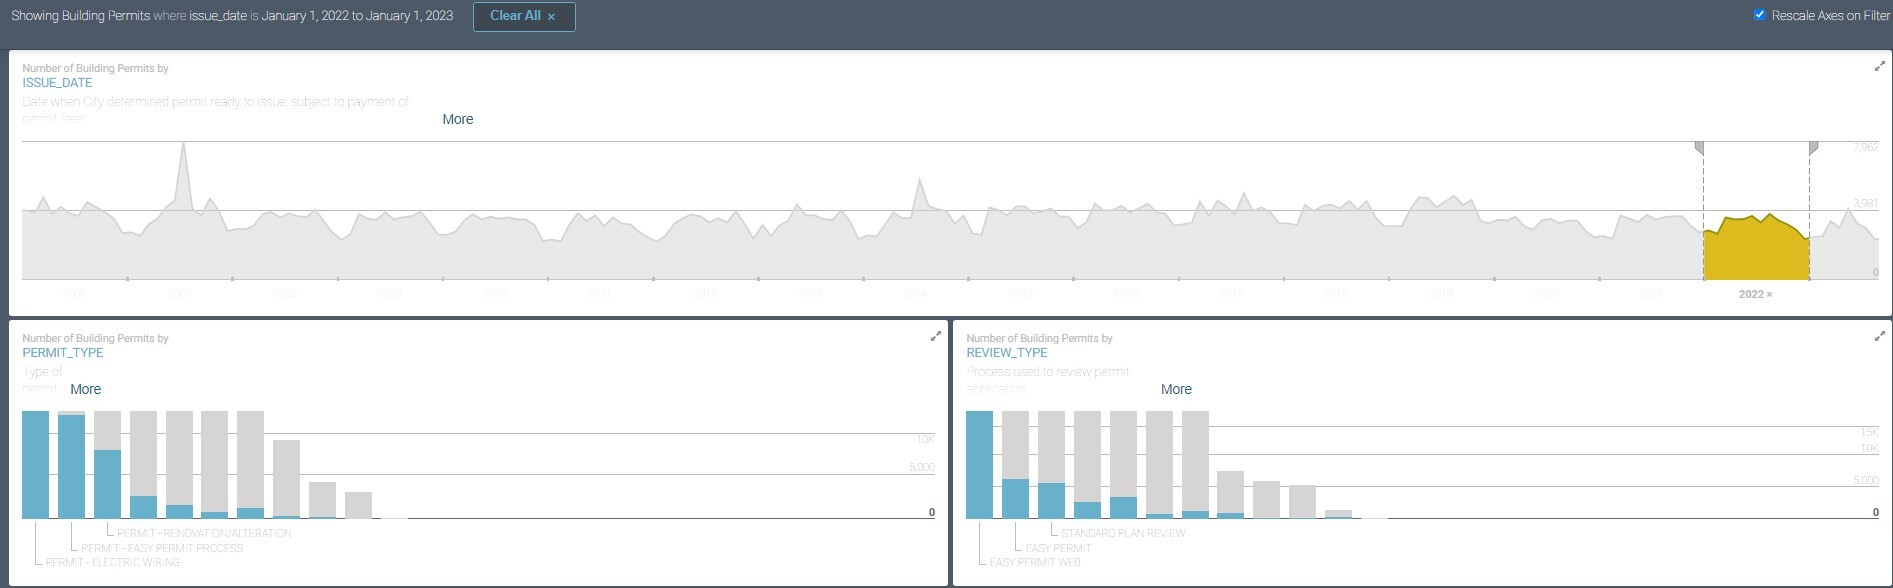
If enabled for a chart, one can also filter just that chart, without affecting other charts. Chart-specific filtering is available for a chart if the inverted pyramid symbol appears when no global filter has been applied.
In the example here, the timeline is again filtered for 2022 but on a chart-specific basis. Note that the timeline (upper left) chart looks the same as in the earlier screenshot but the other charts do not, because they are not filtered.
Identifying Charts
One of the things that, unfortunately, was lost in the bulk migration of Data Lens pages to Story pages was the title on each chart telling which column is shown. In some cases, it should be clear what a chart represents but in some cases, it will not.
As possible, we will add titles to charts that seem particularly significant and/or ambiguous but it is unlikely that we will be able to do this for most or all charts. So, we wanted to give some hints for determining what a chart shows.
Charts generally follow the same order as the columns in the Global filter, going across each row of charts and then down to the next row. So, the images above that show four charts are ISSUE_DATE (upper left), PERMIT_TYPE (upper right), REVIEW_TYPE (lower left), and REPORTED_COST (lower right).
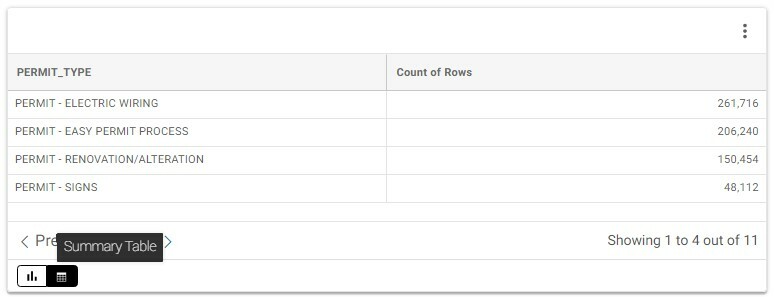
In addition, by default, each chart shows the chart, itself, but clicking the toggle in the lower left of the card will switch to the Summary Table view, which displays the name of the column used.
Getting to the Data
Each Dashboard page displays data from a single dataset. (A Story page actually can display data from multiple datasets and we may create such Stories in the future but, because Data Lens pages were limited to a single dataset, the converted Story pages are, as well.)
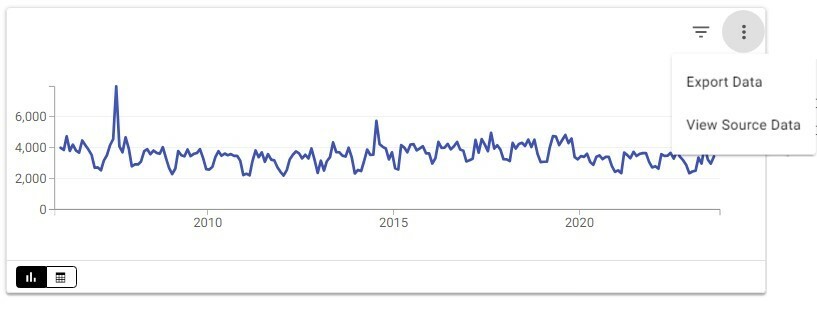
The bottom of each Dashboard page shows a preview of the data but there are other ways of getting to it, as well.
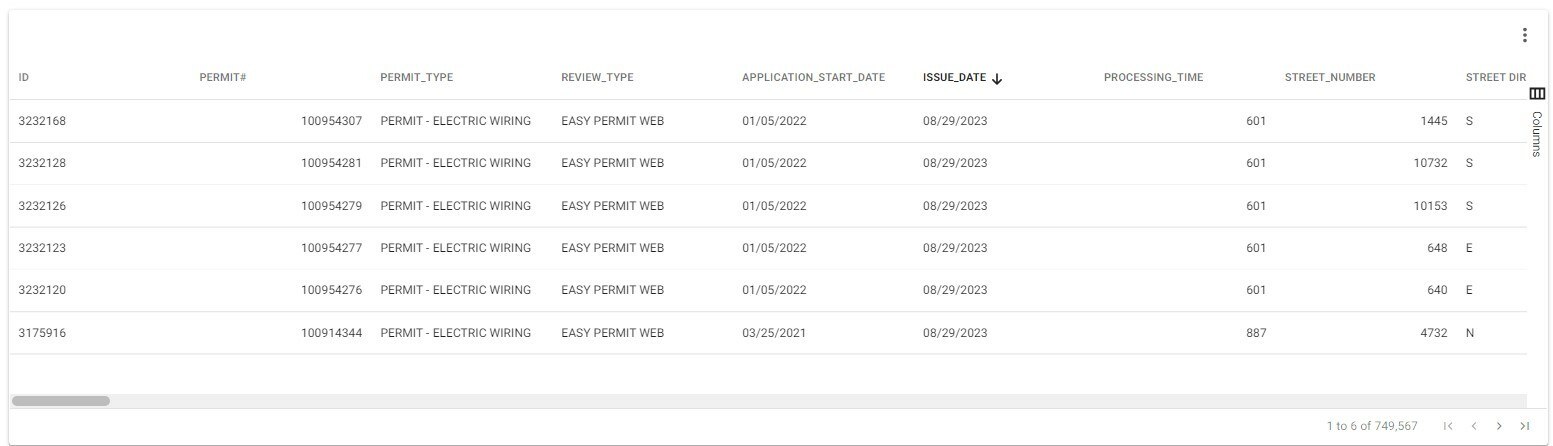
From the same menu, one can click View Source Data to open the dataset on which the chart is based.
 |
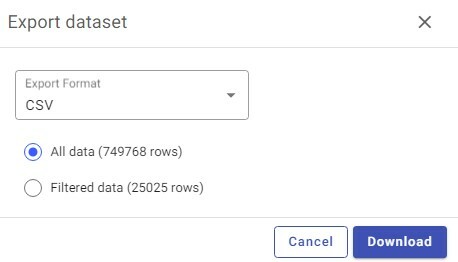 |
Each chart has three vertical dots in the upper right. Clicking these dots brings up a menu. Click Export Data to export the data in any of multiple formats. If the chart is filtered, either through the Global Filter or a chart-specific filter, one can choose between exporting all rows or just the currently filtered rows.
Printing a Dashboard
Story pages, including the converted dashboards, can be opened in a print preview mode and printed. However, there is a known issue with the formatting, which is expected to be fixed in late 2023.
Similarly, one can subscribe to a Story page to have the then-current version e-mailed in PDF format on a scheduled basis. Because the PDF is an automatically printed version, it suffers from the same issue.
For More Information
As mentioned above, please feel free to e-mail us with any questions, comments, or concerns.
In addition, as also mentioned above, the company that hosts our data portal has a support site with articles on Stories and many other topics. By using the SUBMIT A REQUEST button at the top of any page, you can send a question, comment, suggestion, or other message to that company.