
Persistent Inequities
 Persistent Inequities
The Chicagoans who are exposed to the greatest disparities in human health, economic hardship, and community violence, are also the most likely to die in traffic crashes, regardless of the circumstances.
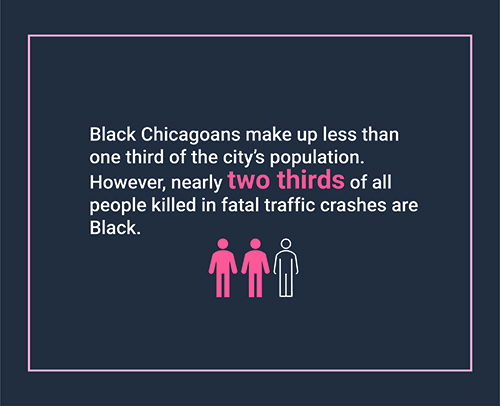
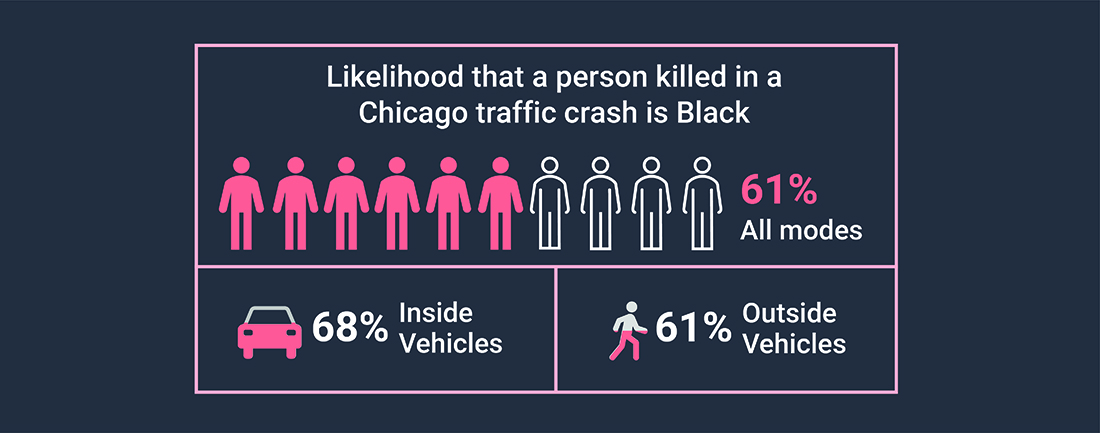
Black Chicagoans are more deeply affected by traffic violence than any other demographic. Regardless of location or circumstances, nearly 2/3 of all people killed in Chicago’s traffic crashes are Black, yet they make up less than 1/3 of Chicago’s population.
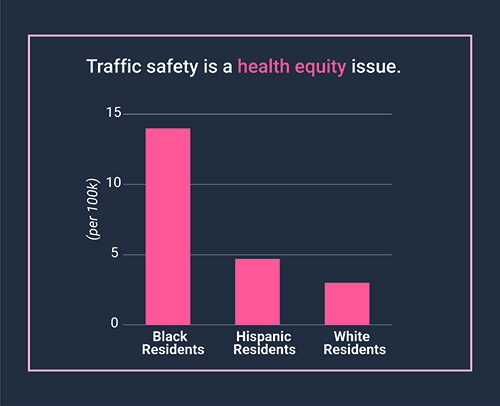
Tragically, this pattern is consistent with other stark inequities faced by Black Chicagoans, such as overall life expectancy, diabetes-related deaths, homicide, infant mortality and others reported by the Chicago Department of Public Health (CDPH) 2021 data brief on the State of Health for Blacks in Chicago.
In 2021, black Chicagoans were killed in traffic crashes at 3.8 times the rate when compared to the City's non-black population.
Data Source: Chicago crash statistics featured in the section above are based on data provided by the Cook County Medical Examiner's Office for 2021.
Geography & Mobility Hardship
Communities most affected by traffic violence also face the biggest barriers to transportation access and economic hardship. To understand and prioritize areas of greatest need, CDOT uses the Mobility and Economic Hardship Index (MOBEC). This tool was created in partnership with the Center for Neighborhood Technology (CNT) to identify community areas with the greatest need for focus and investment.
Building on Chicago Department of Public Health’s Economic Hardship Index, CNT applied a public health lens to transportation hardship factors like commute time, percent of population with a disability, and transportation cost as a percent of household income. As a result 30 Community Areas have been identified as experiencing high MOBEC hardship.
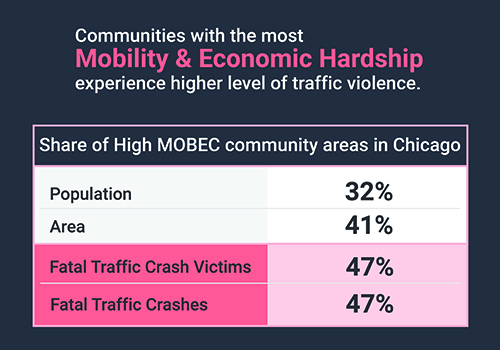
The 30 Community Areas experiencing high MOBEC hardship make up 41% of Chicago's land area and only 32% of the population live there, yet these residents make up 47% of people killed in traffic crashes.
Of all the people killed while walking in this time period, 40% lived less than mile from site of the crash.
Data Source: Chicago crash statistics featured on this page are based on Chicago Police Department provisional data for 2023.