Hospital Admission Levels
Hospital Admission Levels
Local Hospital Admission Levels
CDPH recommends that communities and individuals reference the hospital admission level for the greater Cook County area when making decisions about what preventive actions to take against COVID-19. Hospital admissions remain one of the most reliable indicators of COVID-19 activity in our region.
Healthcare providers and laboratories in Illinois are still required to report COVID-19 cases to the public health department after the expiration of the Public Health Emergency (PHE) declaration. Cases represent those who are found to have COVID-19 after going to a healthcare provider or laboratory to be assessed and/or tested. Case reporting may continue to become less representative of Chicago’s population over time due to the availability of at-home tests (the results of which are not reported to CDPH) and widening gaps in testing access and utilization across the city.
The U.S. government requires hospitals to submit data related to health care system stress, capacity, capabilities, and the number of patients hospitalized with COVID-19. Hospital admission levels are derived from the total number of admissions of patients with laboratory-confirmed COVID-19 each day, as reported by hospitals. In an analysis by the CDC, hospital admission levels were found to track closely with COVID-19 Community Levels (CCLs), the main indicator of COVID-19 community risk utilized through the end of the PHE declaration. The hospital admission level remains a reliable and representative indicator of COVID-19 activity in Chicago and larger Cook County. More detailed information on hospital reporting can be found on the CDC’s website.
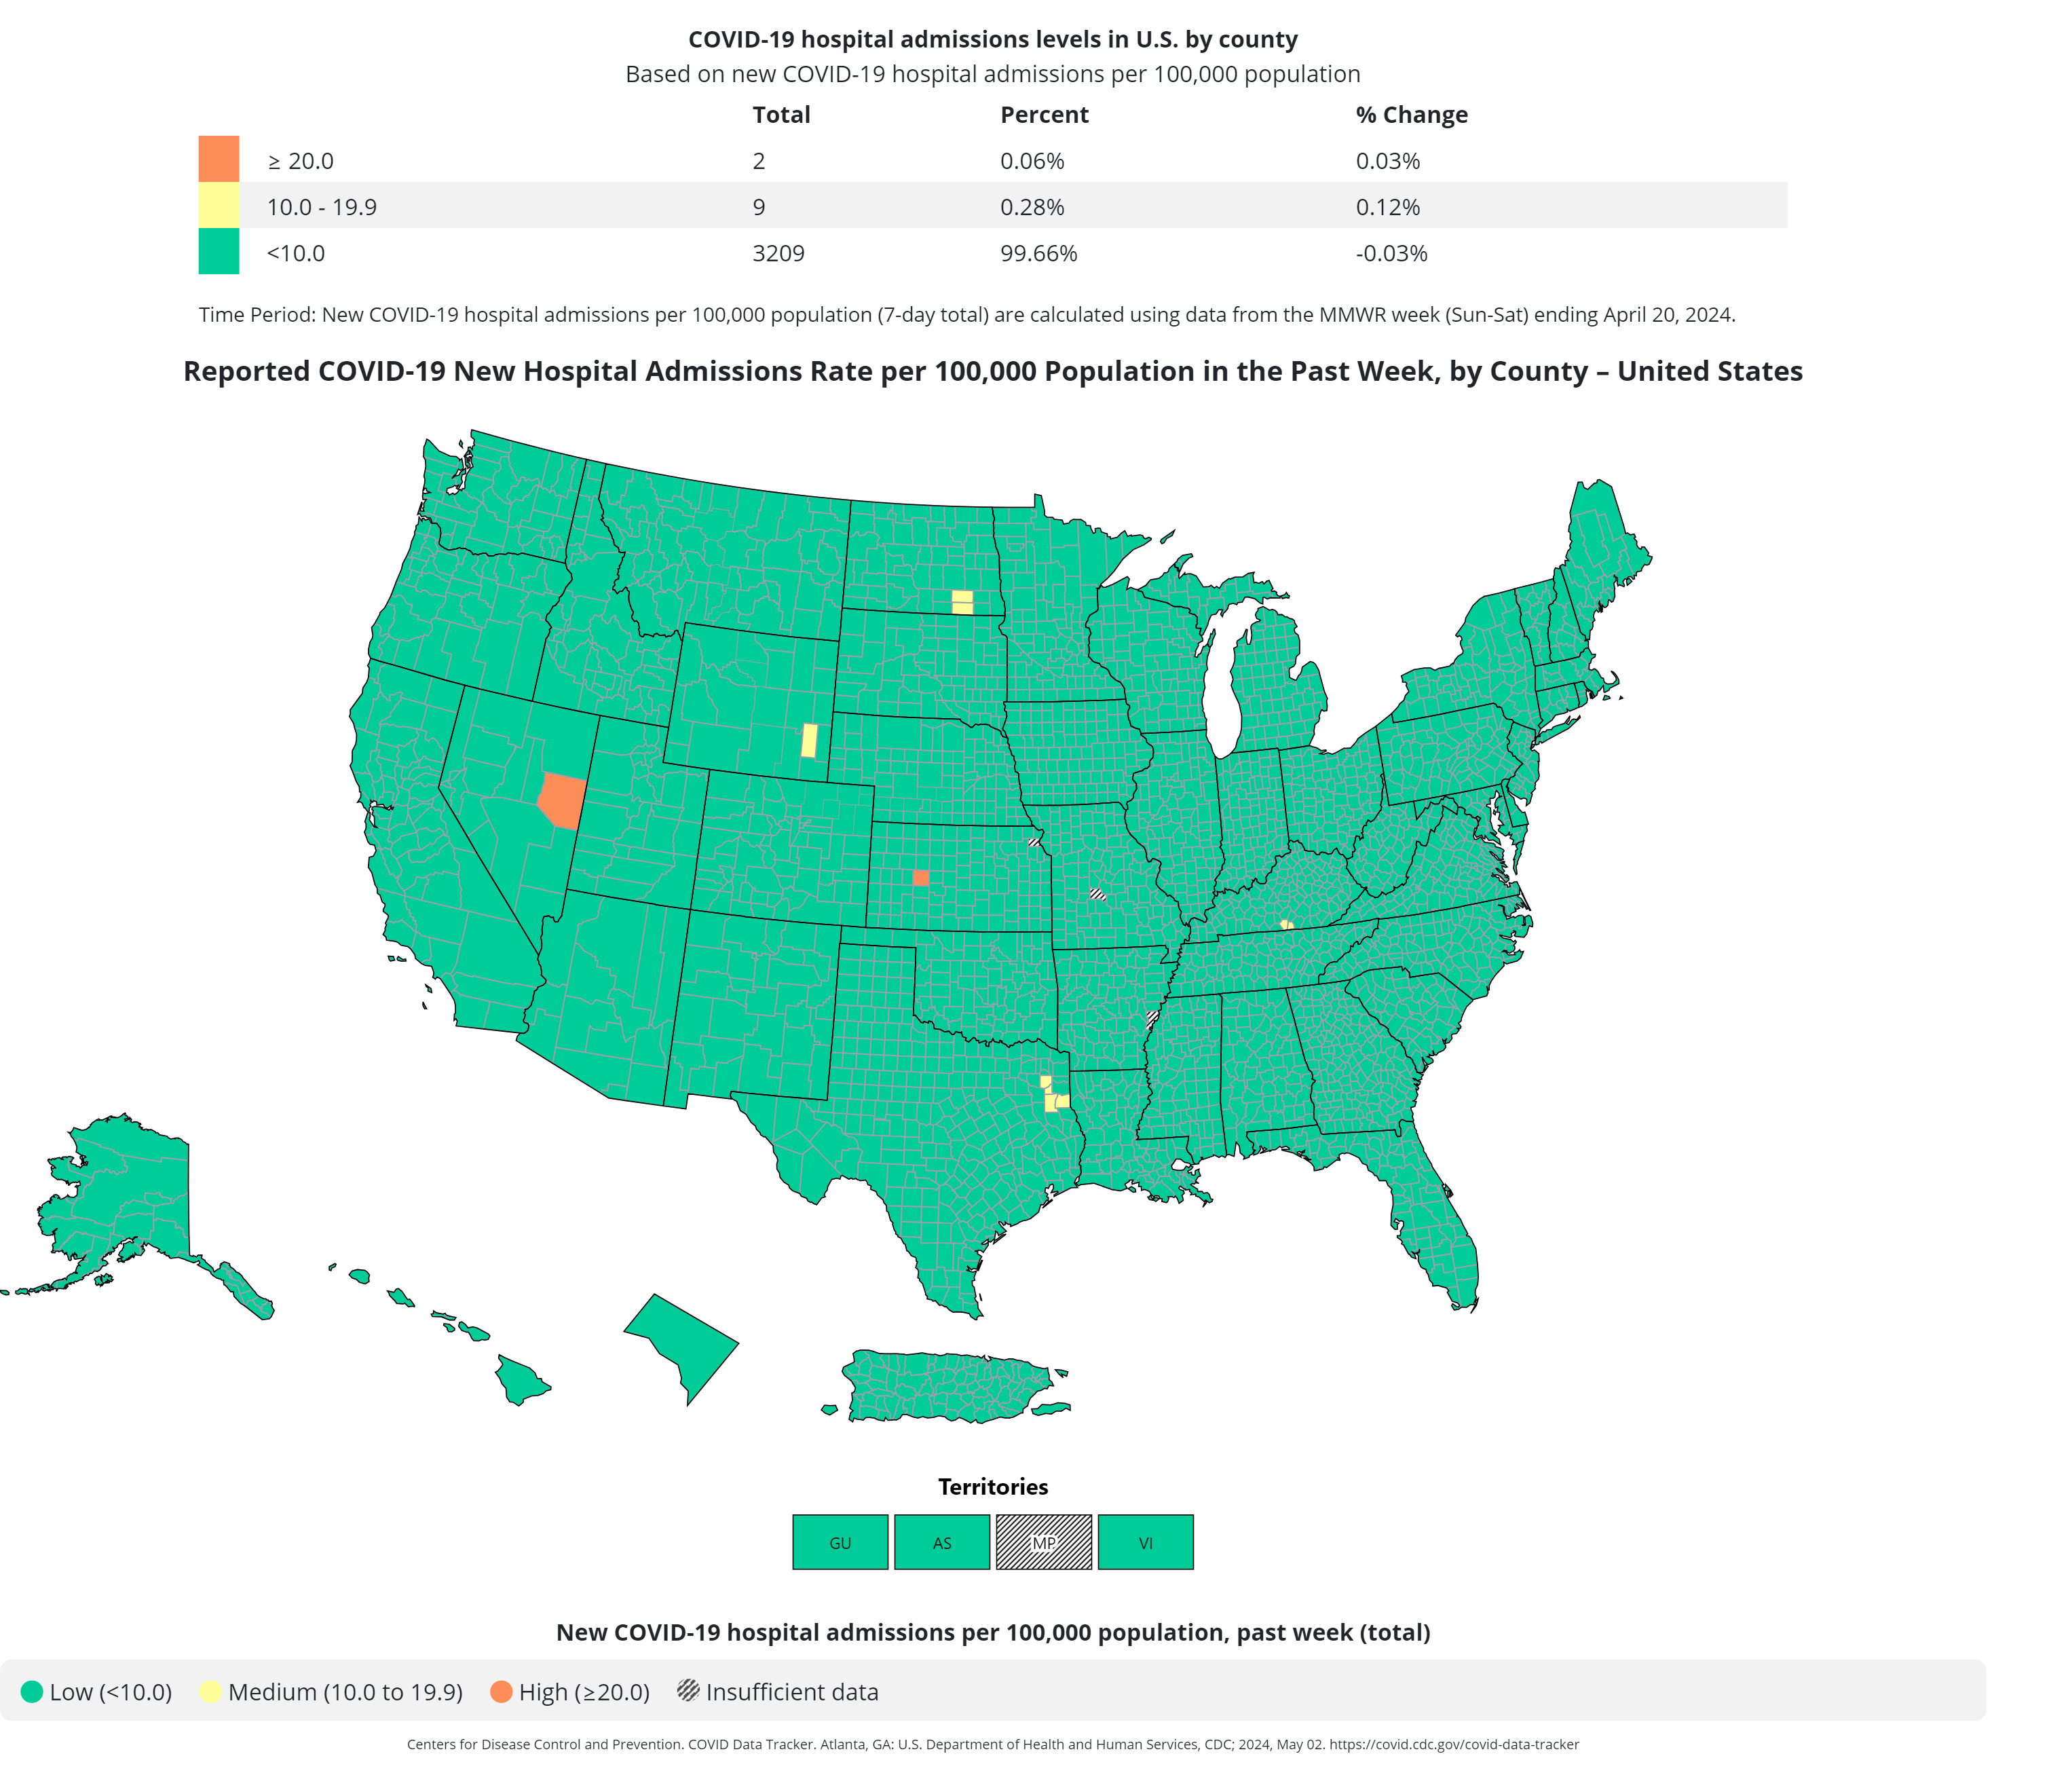
Hospital admission levels are determined by the number of new hospital admissions per 100,000 population over the past week: <10.0 = Low, 10.0-19.9 = Medium, ≥20.0 = High. Note that use of hospital admission levels to drive recommendations for protecting individuals and communities from COVID-19 began after the end of the public health emergency declaration on May 11, 2023. CDPH has used various metrics and indicators to inform COVID-19 public health strategies and recommendations over time as the pandemic evolved. The graph above shows what hospital admission levels would have been in the past (prior to May 11, 2023) for the purposes of providing historical context.
Centers for Disease Control and Prevention Covid Data Tracker
Visit https://covid.cdc.gov/covid-data-tracker/#cases_new-admissions-rate-county for more information.
CDPH will continue to monitor multiple data sources to inform public health guidance and interventions. We will continue to share data about COVID-19 activity in Chicago through our dashboard webpages and the Chicago Data Portal. We are also expanding our use of wastewater testing and genomic sequencing as a supplement to hospital and laboratory case reporting to enhance our understanding of how COVID-19 is spreading in our communities. CDPH also provides information about influenza, COVID-19, RSV, and other viral respiratory disease activity in Chicago in its weekly respiratory virus surveillance report.
About the Data
Hospitals are required to report COVID-19 hospital capacity and utilization metrics to the CDC’s National Healthcare Safety Network (NHSN), which monitors national and local trends in healthcare system stress, capacity, and community disease levels. Data reported by hospitals to NHSN represent aggregated counts and include metrics capturing information specific to hospital capacity, occupancy, hospitalizations, and admissions.
The hospital data displayed on this page are based on calculations performed at the Health Service Area (HSA) level. The HSA to which Chicago belongs includes hospitals in Cook, Lake, DuPage, and McHenry counties. The new hospital admissions rate for Cook County is calculated as the total number of new COVID-19 patients admitted to hospitals located in the HSA over the past week (Sunday-Saturday) divided by the population of Cook, Lake, DuPage, and McHenry counties, multiplied by 100,000 population. As such, estimates include both Chicago and non-Chicago residents. Population estimates are from the U.S. Census Bureau 2019 American Community Survey 1-year estimate.
Data submitted by hospitals are reviewed and verified by CDC before the CDC Data Tracker is updated on Thursdays. CDPH uses data reported by hospitals to NHSN that are housed within the national HHS Protect platform to estimate hospital admission levels for weeks prior to the end of the PHE (prior to week ending 5/6/2023). A public-facing version of this dataset can be found at healthdata.gov. Hospital admission levels for all weeks since (and including) the week ending 5/6/2023 are obtained from data.CDC.gov.
| Low | Medium | High | |
| New COVID-19 admissions per 100,000 population (7-day total) | <10.0 | 10.0-19.9 | ≥20.0 |
For those traveling, the Chicago Department of Public Health (CDPH) recommends Chicagoans take precautions against COVID-19 if visiting areas of the United States that have clusters of medium to high COVID-19 risk levels, based on the CDC’s COVID-19 hospital admission levels.


